×
Home
Class Calendars
Period 1 - Math 8
Period 3 - Math 8
Period 5 - Algebra 1
Tests & Quizzes
Textbook Resources
Other Information
Calculators
Desmos Graphing Calculator
GeoGebra Calculator Suite
TestNav Graphing Calculator (TI-84)
TI-84 Online (ti84calc.com)
TestNav Scientific Calculator
TI-30XS Calculator
Weighted Average Calculator
E-mail Sign Up
Morning Pass
Snow Day Predictions
Unit Test Results
Watchung Schools
☰
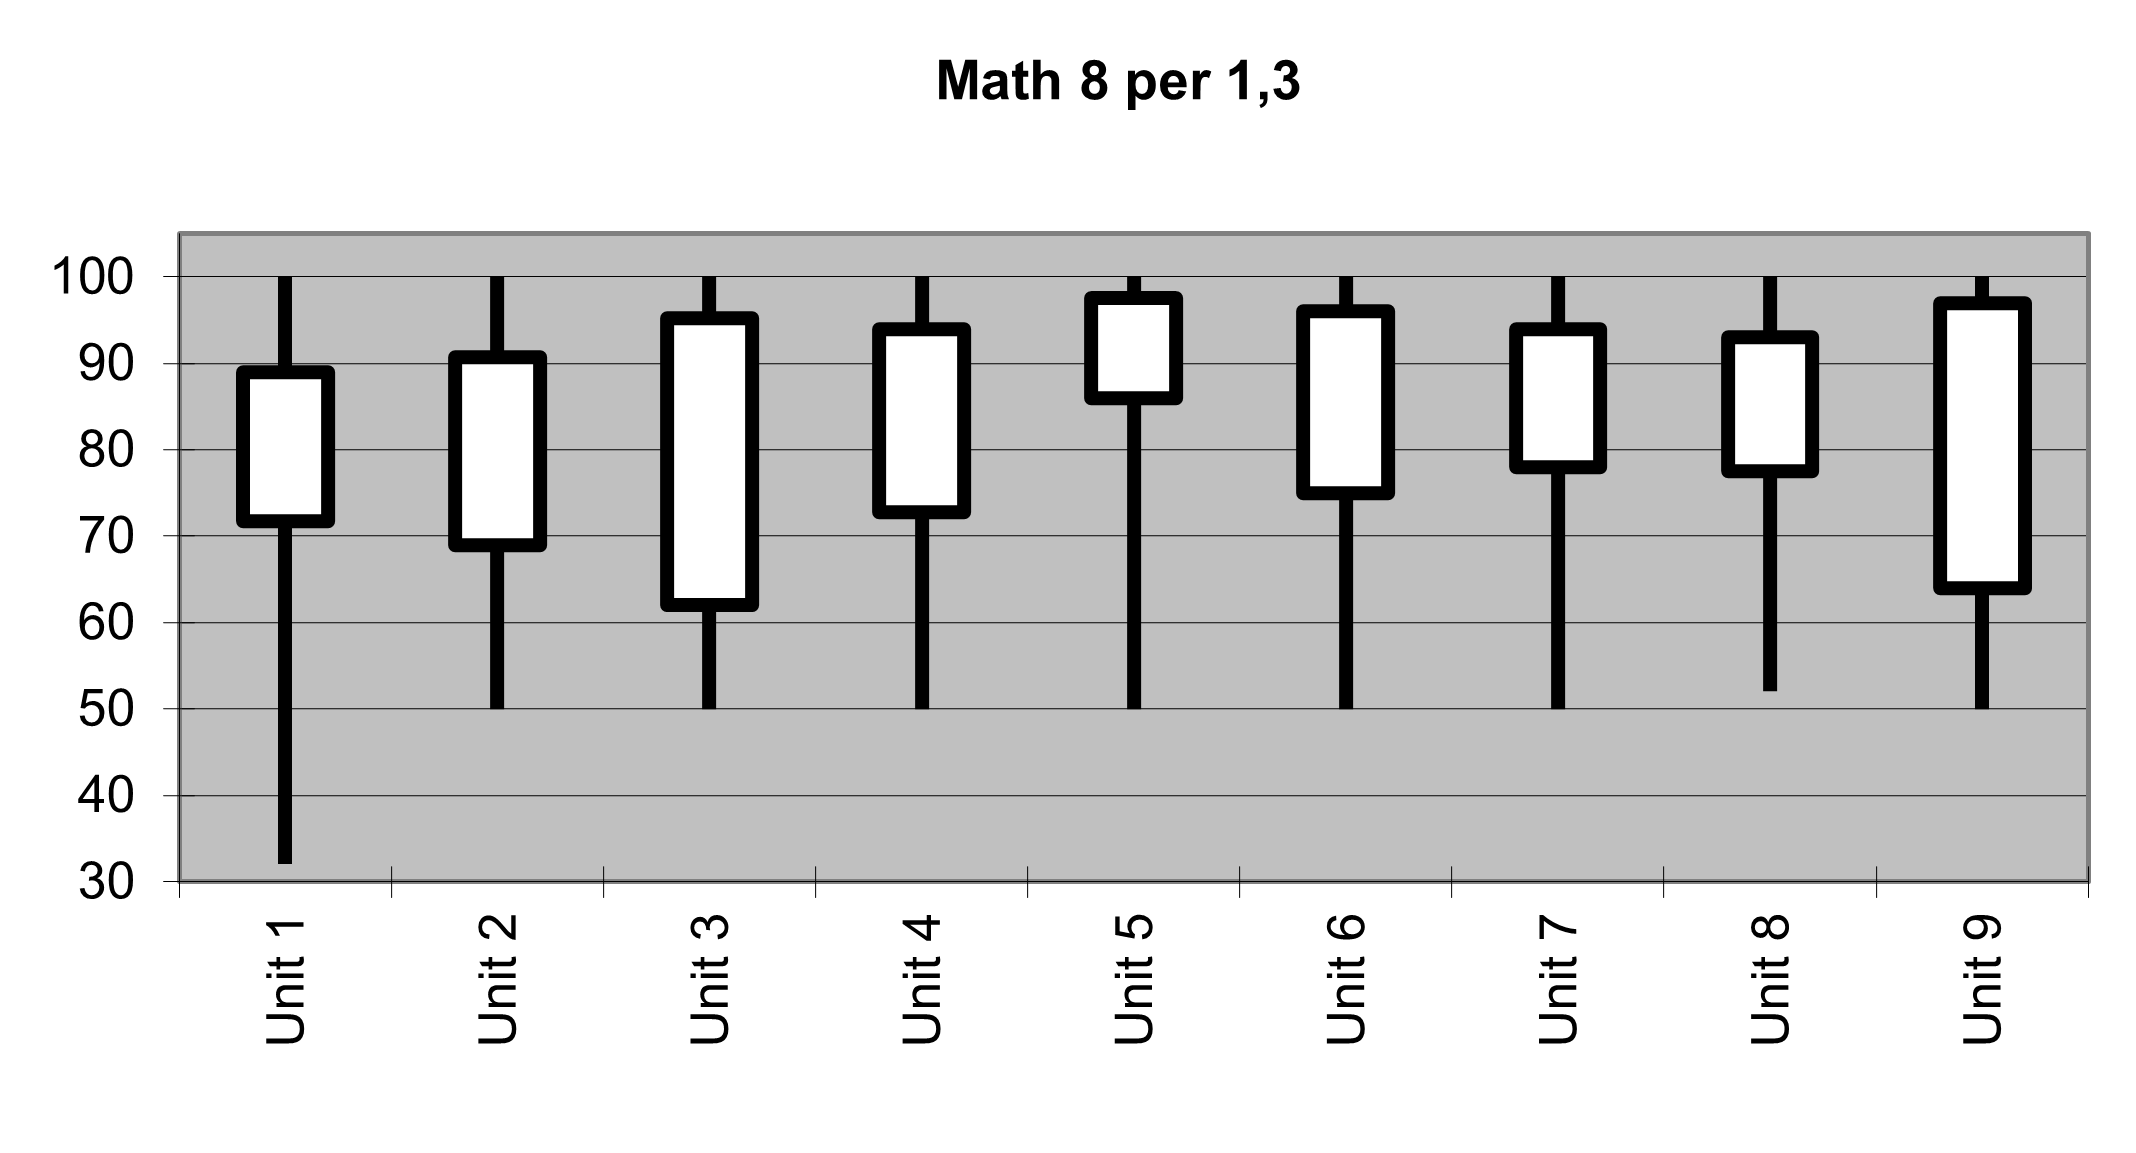
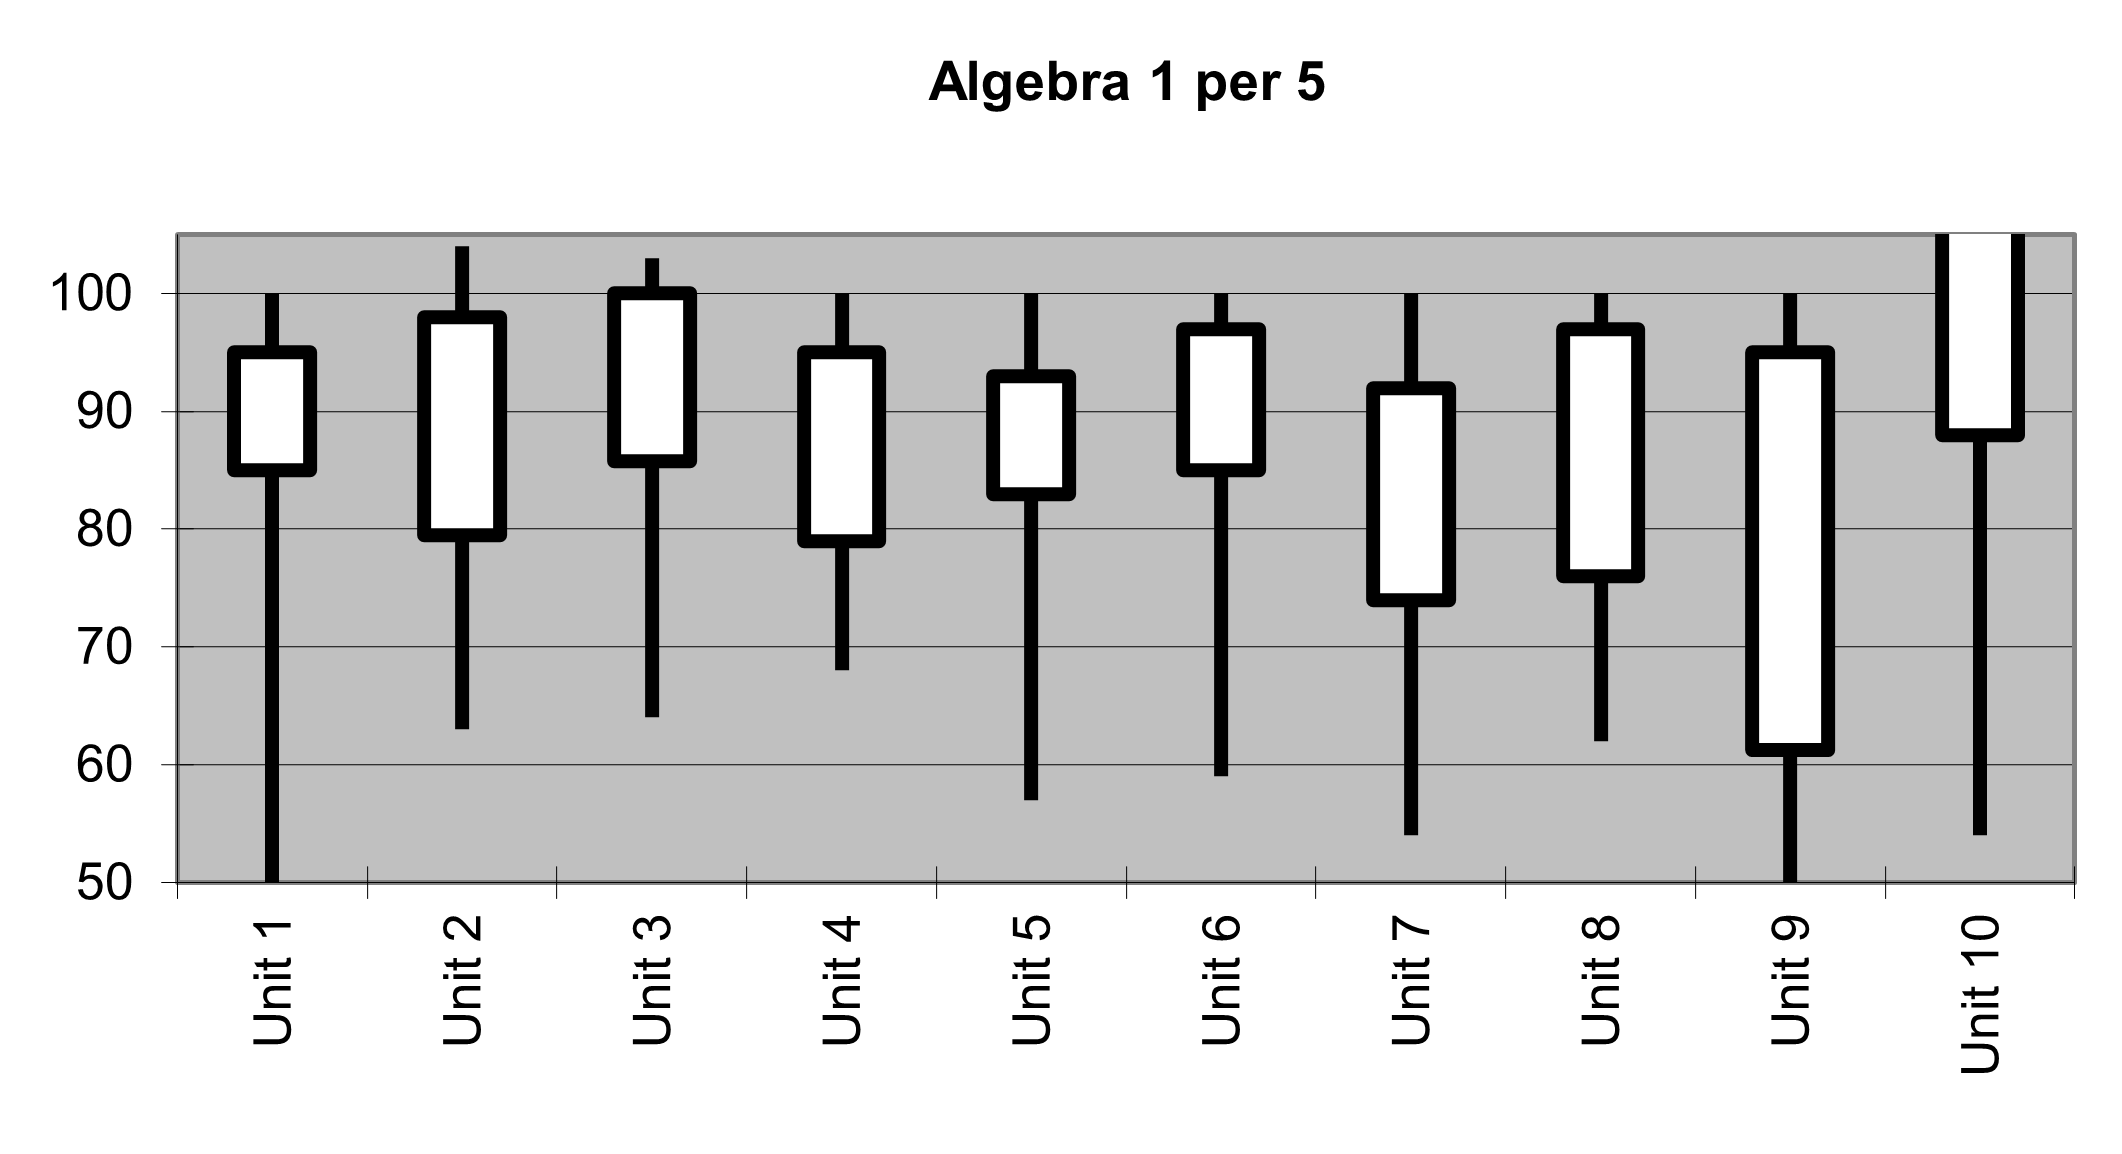
Test Results
Below are charts showing the distribution of chapter test scores. The charts are modified box-and-whisker plots. The boxes show the middle 50% of scores. The whiskers extend to the minimum and maximum scores.